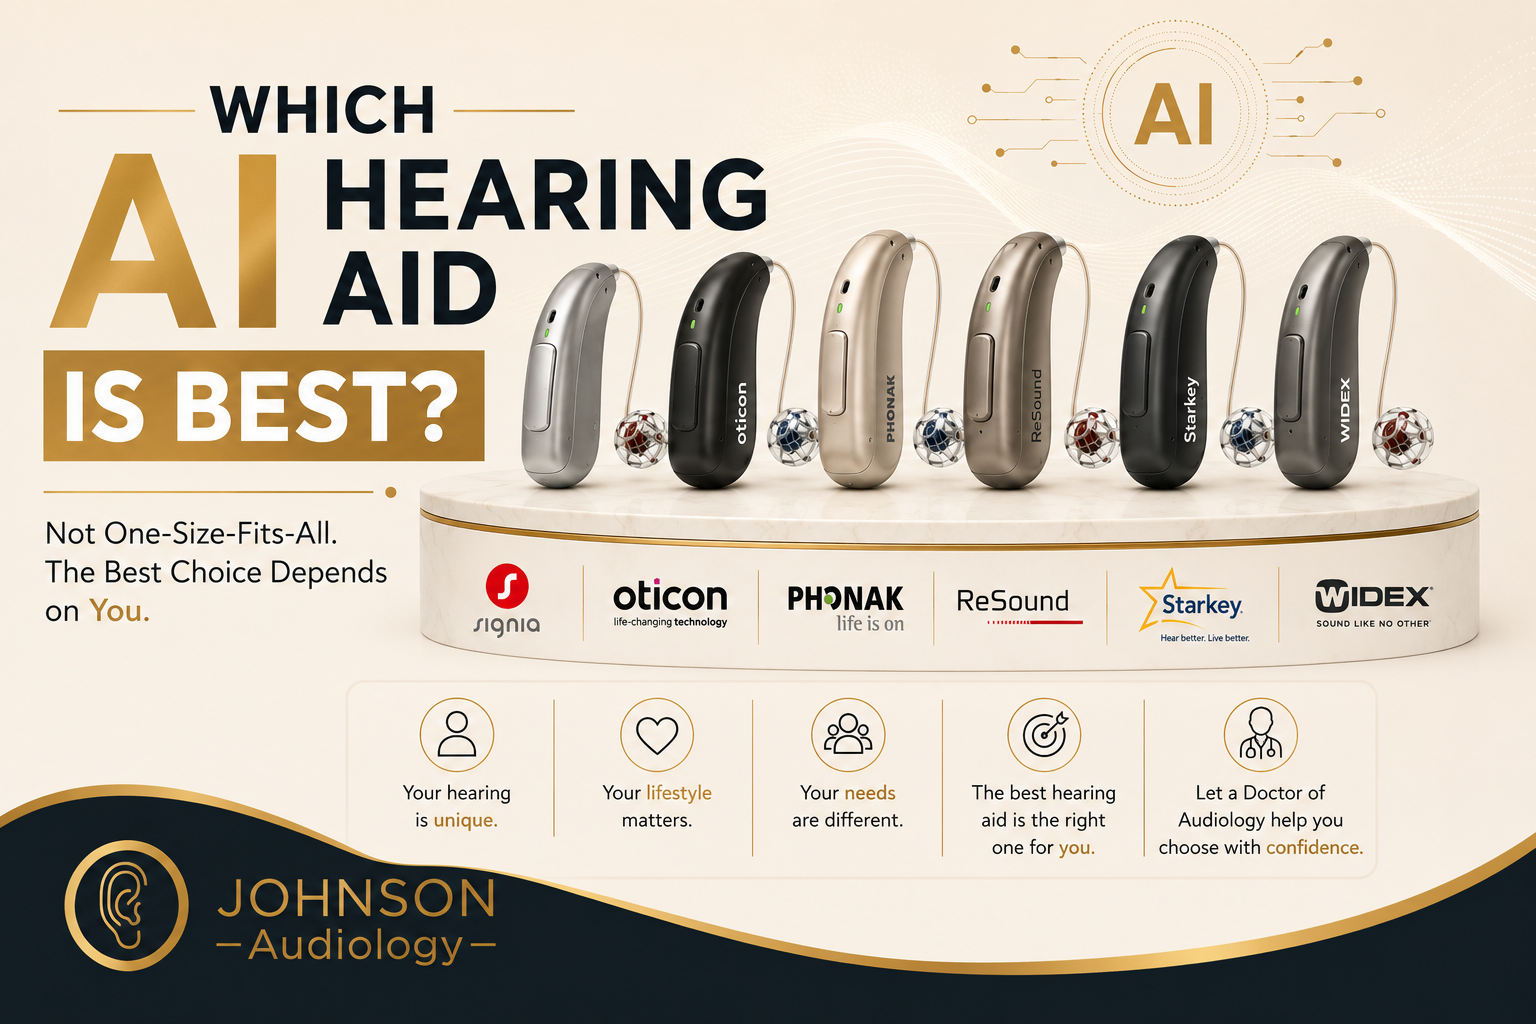
Artificial intelligence is becoming a bigger part of hearing aid technology. Today’s hearing aids can use advanced sound processing to help identify speech, manage background noise, adapt automatically to different environments, and make listening more comfortable. That has led to a common question: Which AI hearing aid is the best? The answer is not as simple as choosing one brand or model. Different manufacturers use AI in different ways, and the technology that works best for one person may not be the best fit for someone else. What Does “AI Hearing Aid” Mean? In general, AI-powered hearing aids use advanced processing to analyze sound and decide how the hearing aid should respond. Depending on the device, that may include: Identifying speech in noisy environments Reducing unwanted background noise Prioritizing certain voices Adjusting automatically as surroundings change Improving comfort in complex listening environments Supporting clearer phone calls and streaming While many manufacturers use similar terms, the technology behind those features can work very differently. Are All AI Hearing Aids the Same? No. Different manufacturers may focus on different listening challenges. One system may emphasize helping the wearer follow speech in a crowded restaurant. Another may focus more on preserving awareness of the surrounding environment. Others may prioritize personalization, automatic adjustments, connectivity, or listening comfort. So even though two hearing aids may both be described as “AI-powered,” they may create very different listening experiences. The better question is: How well does that technology match the situations where you need the most help? What Can AI Hearing Aids Help With? AI-based hearing technology may be especially useful in situations such as: Restaurants and social gatherings Group conversations Meetings Conversations in the car Outdoor environments with wind or traffic noise Situations where several people are talking at once For many people, understanding speech in background noise is one of the biggest hearing challenges. Newer hearing aids are increasingly designed to analyze these environments and make speech easier to follow. However, the amount of benefit can vary from person to person. Why Isn’t There One “Best” AI Hearing Aid? There isn't one "best" AI hearing aid because no two people hear exactly the same way. Choosing the right hearing aid depends on more than a list of features. Your audiologist may consider: Your hearing loss. The type and degree of hearing loss can affect which devices and features are most appropriate. Your daily listening environments. Someone who spends a lot of time in restaurants, meetings, and group settings may have different priorities than someone who spends most of their time in quieter environments. Your lifestyle and technology preferences. Work, travel, hobbies, phone use, streaming, recharge-ability, device style, and ease of use can all influence which hearing aid feels like the best fit. Your hearing goals. Ultimately, the most important question is what you want your hearing aids to help you do more comfortably and confidently. Does Newer AI Automatically Mean Better Hearing? Not necessarily. New technology can offer meaningful improvements, but the newest hearing aid is not automatically the best choice for every person. A device may have impressive features but still not match your hearing loss, lifestyle, or preferences. That is why professional selection and fitting remain so important. The technology itself is only one part of the process. How a hearing aid is programmed, verified, adjusted, and supported over time can have a major impact on how well it works for you. How Can an Audiologist Help Me Compare AI Hearing Aids? A Doctor of Audiology can help turn technical features into a much more useful question: What will this actually mean for the way I hear every day? At Johnson Audiology, we work with multiple leading hearing aid manufacturers. That allows our audiologists to consider different technologies based on the patient rather than beginning with one predetermined brand. Your audiologist can look at your hearing test, the situations where you struggle most, your lifestyle, your technology preferences, and your goals before recommending a solution. So, Which AI Hearing Aid Is Right for Me? The best AI hearing aid is not necessarily the one with the longest feature list or the newest technology. It is the one that best matches: Your hearing loss Your listening environments Your lifestyle Your technology preferences Your comfort needs Your hearing goals As hearing aid technology continues to advance, patients will have more options than ever. That makes personalized guidance even more important. Curious About AI Hearing Aid Technology? If you are wondering whether newer AI-powered hearing aids could help you hear better in the situations that matter most, Johnson Audiology can help you compare your options. Our Doctors of Audiology can evaluate your hearing, discuss your listening challenges, and help determine which technology is the best fit for you.

When we think about the benefits of exercise, we often focus on heart health, stronger muscles, better balance or maintaining a healthy weight. But regular physical activity may benefit another important part of your health, too: your hearing. Healthy Blood Flow Matters to Your Ears The inner ear contains delicate structures responsible for converting sound into signals your brain can understand. These structures have significant energy demands and depend on a consistent supply of oxygen and nutrients delivered through the bloodstream. That makes healthy circulation especially important. The cochlea—the hearing portion of the inner ear—has a specialized blood supply, and maintaining normal blood flow helps support its ability to function properly. Regular physical activity is one of the best things we can do to support cardiovascular health and healthy circulation throughout the body. Walking, swimming, cycling, strength training and other forms of exercise can all be part of an active lifestyle. Research has also found an association between physical activity and better hearing outcomes in adults, although exercise cannot guarantee that hearing loss will be prevented. In other words, taking care of your heart and circulatory system is another way of taking care of your ears. What If You Already Have Hearing Loss? Healthy habits are important at every stage of life, but if hearing loss has already developed, it is equally important not to ignore it. Hearing is closely connected to the way we communicate, interact with others and experience the world around us. When hearing becomes difficult, conversations can require more effort. People may begin avoiding restaurants, family gatherings, church, community activities or other situations where understanding speech is challenging. Over time, hearing loss has been associated with reduced quality of life, social isolation and other physical and mental health concerns. That is one reason hearing should be considered an important part of overall wellness rather than something separate from the rest of your health. Treating hearing loss can make everyday communication easier and help people remain connected to the people and activities that matter to them. Research has found that hearing rehabilitation, including hearing aids when appropriate, can improve hearing-related quality of life and may support better social outcomes for adults with hearing loss. Make Hearing Part of Your Healthy Lifestyle Exercise, good nutrition, regular medical care and staying socially engaged all contribute to healthy aging. Hearing care belongs on that list. If you haven't had your hearing evaluated recently—or you've noticed that conversations aren't as clear as they once were—a comprehensive hearing evaluation at Johnson Audiology is a simple way to establish where your hearing stands today. Taking care of your hearing isn't only about hearing sounds more clearly. It's about staying active, connected and engaged in the life you've worked hard to enjoy.

Hearing Loss and Cardiovascular Health: A Vital Connection The inner ear depends on a rich network of healthy blood vessels to deliver the oxygen and nutrients necessary for hearing. Conditions that impair cardiovascular function—including hypertension, atherosclerosis, and other vascular disorders—can compromise this delicate system, increasing the risk of hearing loss. Emerging research continues to demonstrate a strong association between cardiovascular disease and auditory dysfunction, highlighting the importance of recognizing hearing loss as a potential indicator of broader vascular health. At Johnson Audiology, we view hearing care as an important extension of cardiovascular health. Through early detection and collaborative patient management, we help identify hearing changes that may support more comprehensive, whole-person care.